Interface UI integration
smart-doc debug page ^2.0.0
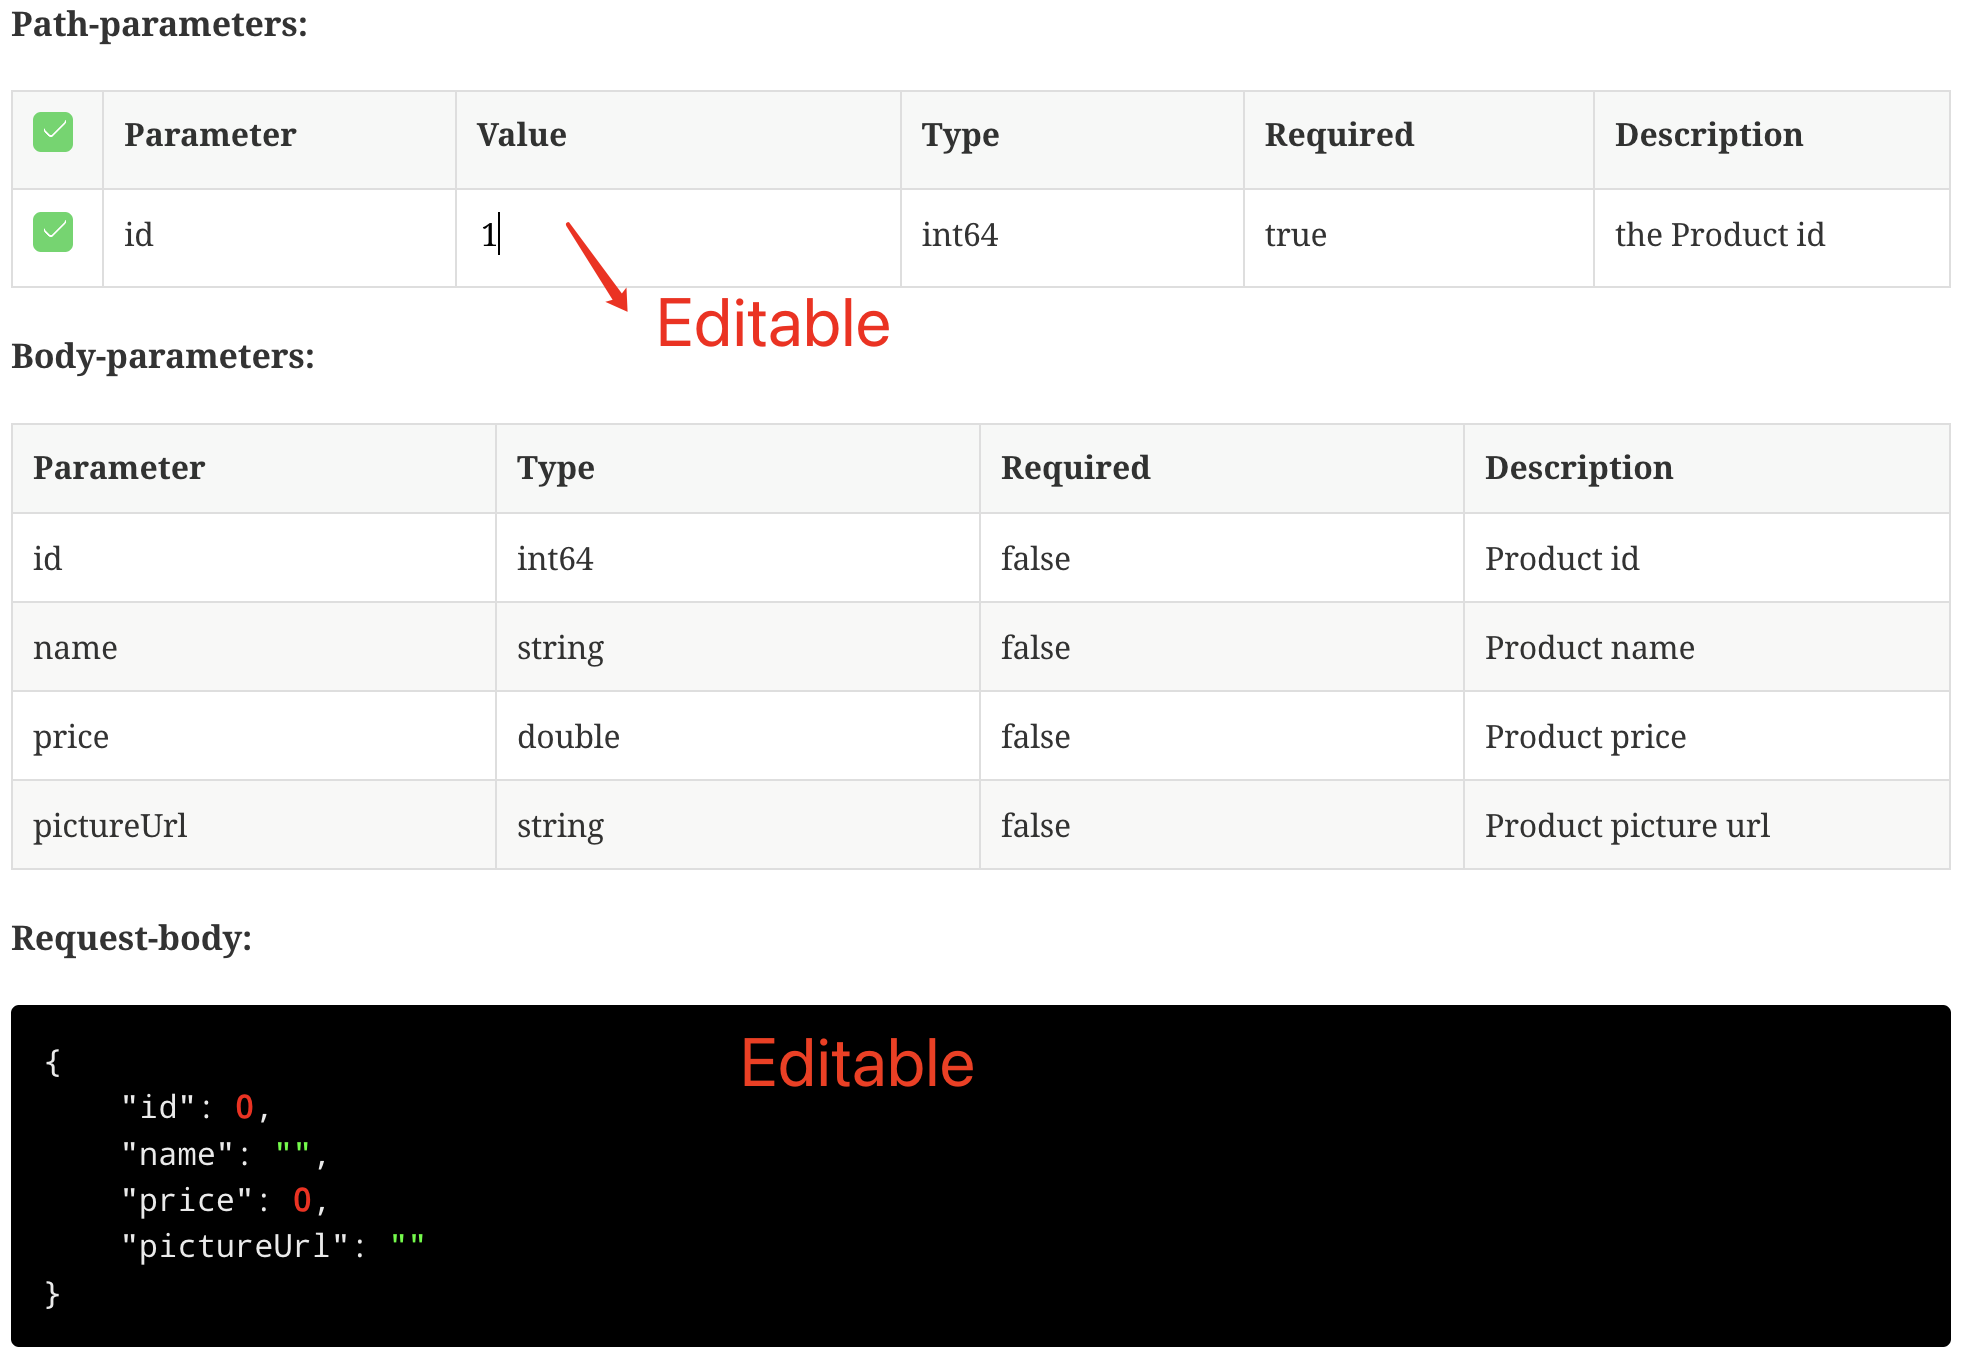
Starting from smart-doc 2.0.0 version, in allInOne mode of html. You can add the configuration of "createDebugPage": true. smart-doc will Create a debug.html page. When letting smart-doc generate documents, put them directly under static/doc/. In this way, you can directly start the program and access the page localhost:8080/doc/debug.html for development and debugging. Starting from smart-doc 2.0.1, debug pages can be generated for html documents in both allInOne and non-allInOne modes. The current debug page of smart-doc supports file upload and file download testing.
Configuration
{
   "serverUrl": "http://localhost:8080",
   "isStrict": false,
   "allInOne": true,
   "outPath": "src/main/resources/static/doc",
   "coverOld": true,
   "style":"xt256",//If you like json highlighting, you can set it
   "createDebugPage": true, //Enable debug generation
   "md5EncryptedHtmlName": false,
   "projectName": "SpringBoot2-Open-Api"
}
Cross-domain configuration
Some developers directly use [Open In Browser] in IDEA to open the debug page generated by smart-doc. If you have to do this, cross-domain will occur when the front-end js requests the back-end interface. Therefore you need to configure cross-domain on the backend. Here takes SpringBoot as an example:
@Configuration
@EnableWebMvc
public class WebConfig implements WebMvcConfigurer {

     /**
      * Cross-domain configuration will overwrite the default configuration.
      * Therefore, it is necessary to implement the addResourceHandlers method and add the default configuration static path
      * @param registry
      */
     @Override
     public void addResourceHandlers(ResourceHandlerRegistry registry) {
         registry.addResourceHandler("/**")
                 .addResourceLocations("classpath:/resources/")
                 .addResourceLocations("classpath:/static/");
     }

     @Override
     public void addCorsMappings(CorsRegistry registry) {
         registry.addMapping("/**")
                 .allowedOrigins("*")
                 .allowedMethods("*")
                 .allowCredentials(true);
     }
}
If you use a server to access the page, no configuration is required.
Interface effect

debug page debugging
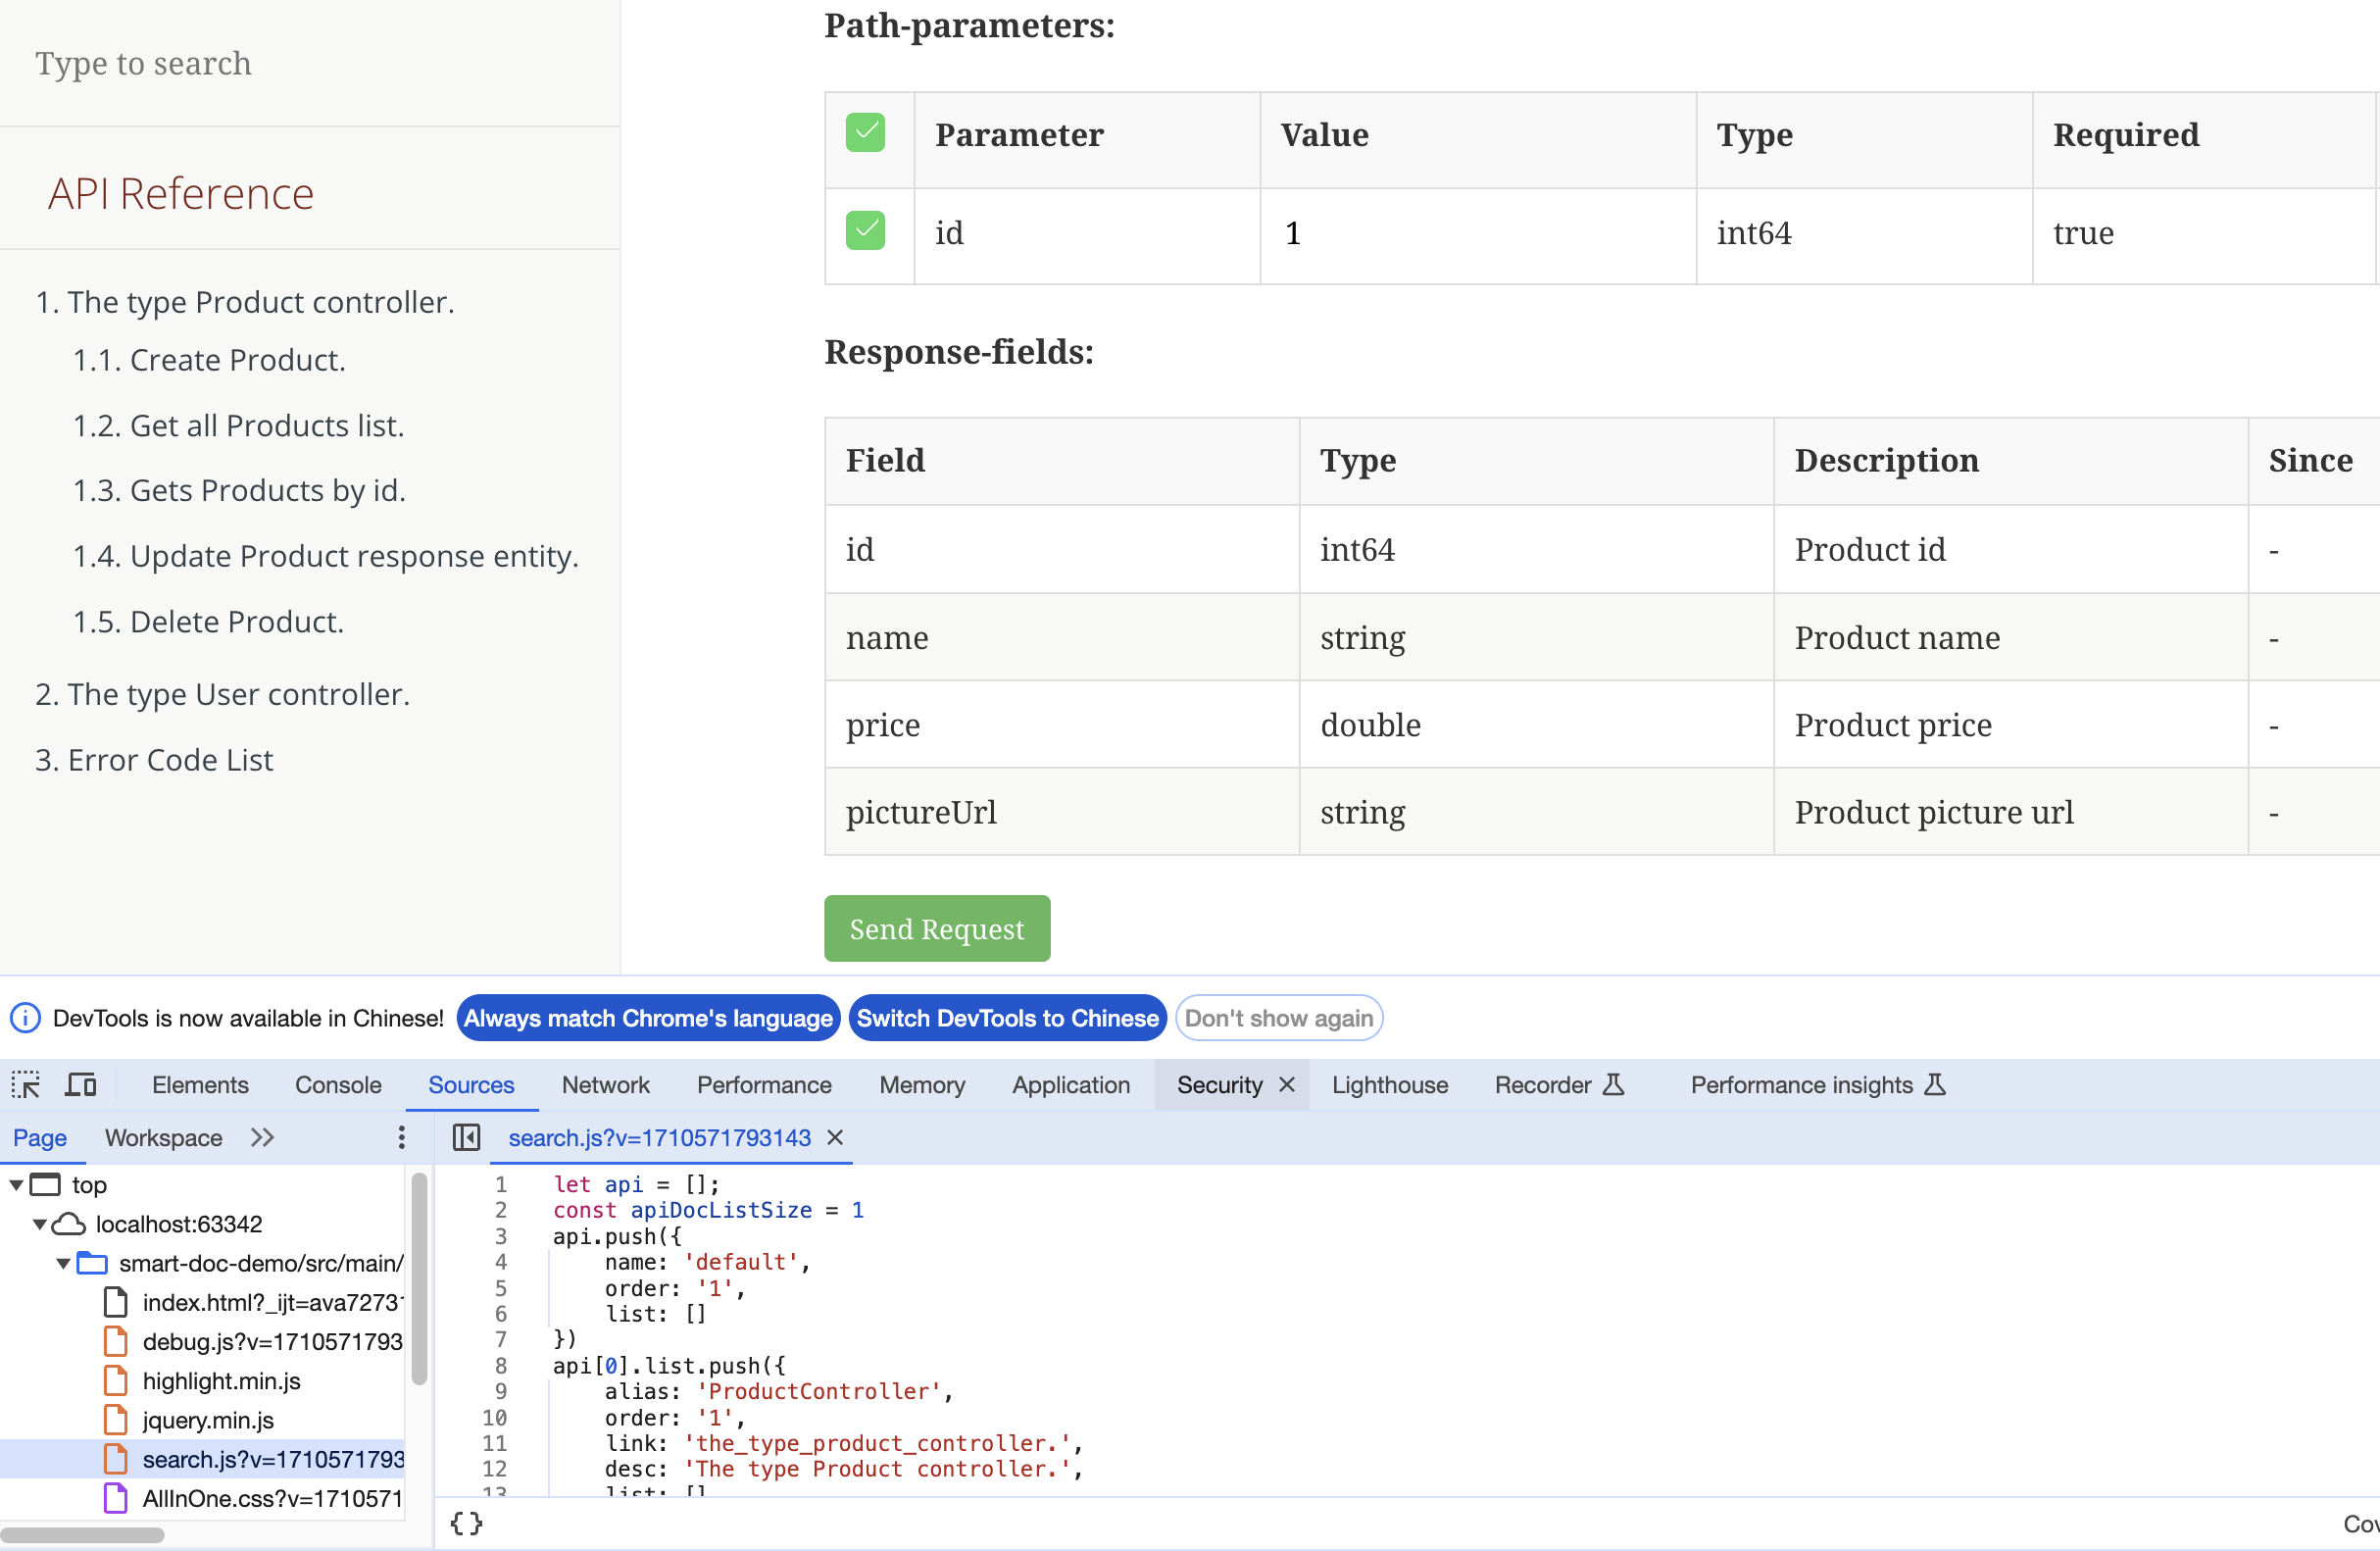
When using the html debugging page generated by smart-doc for interface debugging, you may encounter the following problems: Usually when you click the Send Request button, if the button turns red, it means there is an error in the interface or there is an error on the debug page. At this time, please open the debugging console of the browser to check the problem or debug. The pages created by smart-doc are only developed using jquery and native js. debug.js is used to handle interface test requests, and search.js is used to handle document directory title searches. The source code is not compressed, and you can directly debug the js source code of the page. The debugging operation refers to the following figure:

Swagger implements the debugging interface debugging function by invading a web interface module into the project. Since smart-doc does not intrude into the code, no smart-doc can be seen in the packaged code. Dependency, so if you want to debug the interface, you can only generate html documents into the src/resources/static directory, so that SpringBoot can automatically render the html document page in this range. Of course, the smart-doc debugging page can only upload one file for file upload, which is weaker than the Swagger UI. But smart-doc also has advantages over Swagger UI. For example: the document display is clearer; support for downloading test files
Postman import debugging ^1.7.8
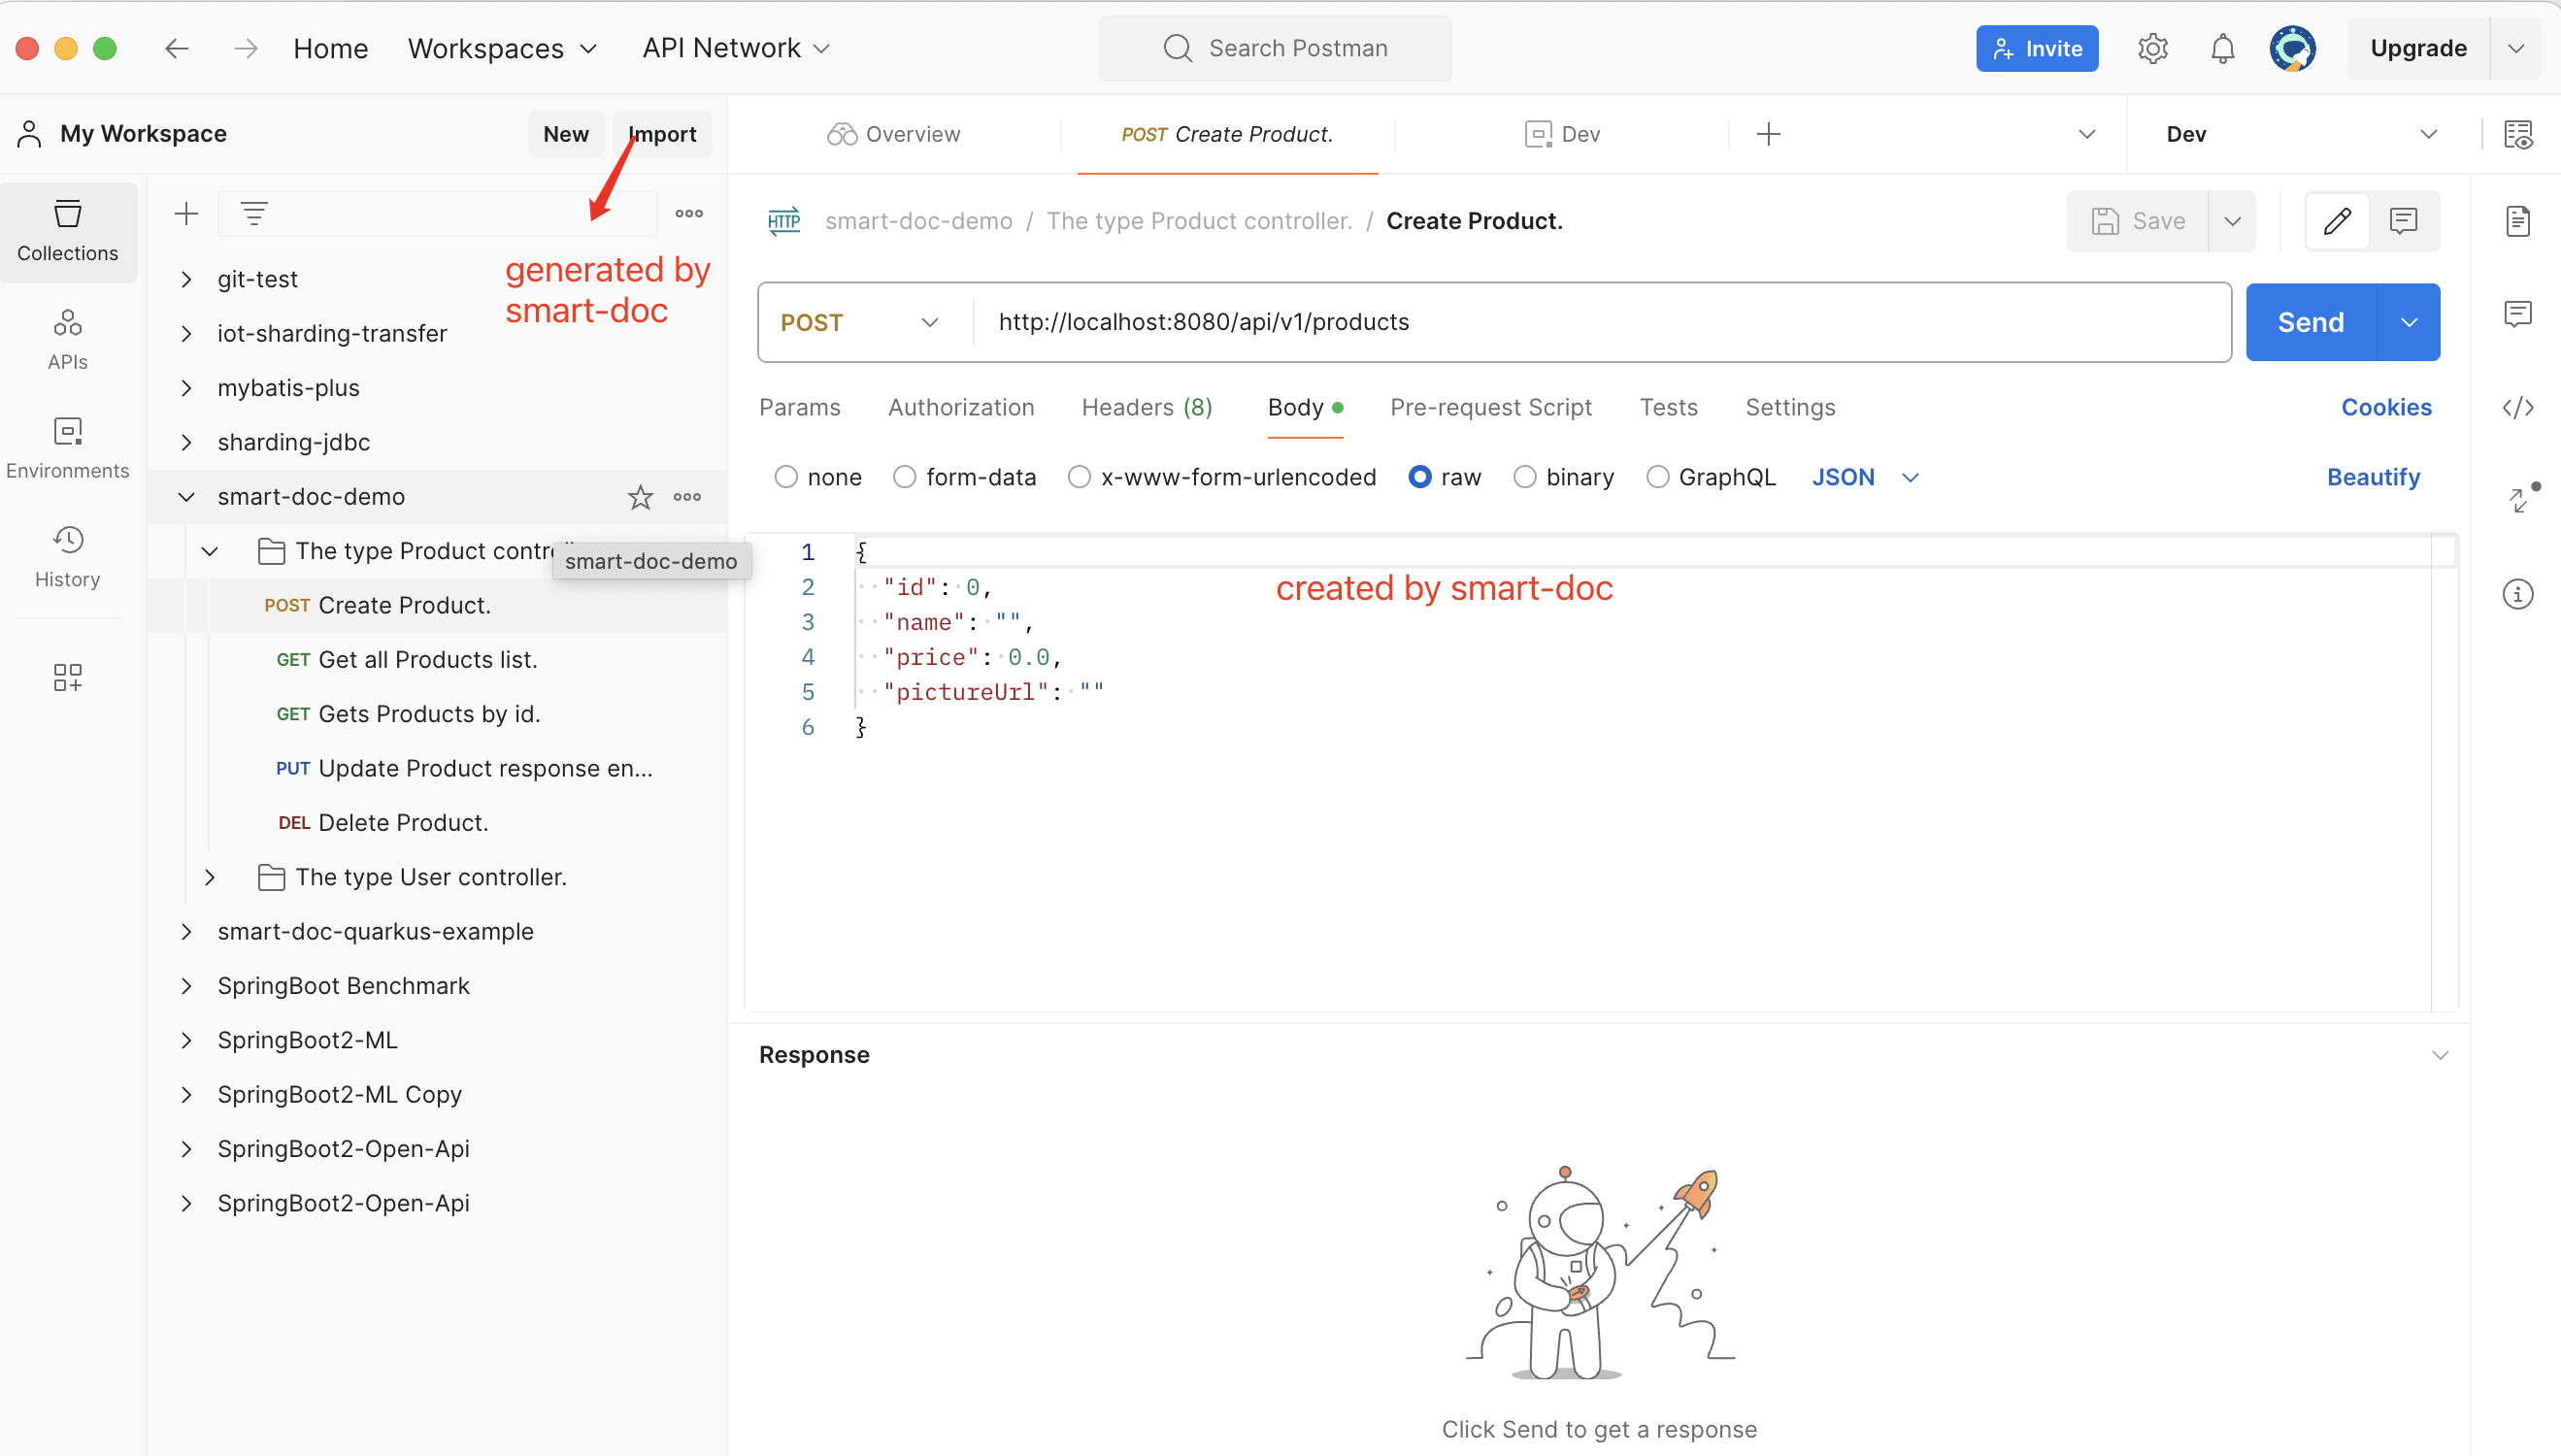
Starting from smart-doc 1.7.8 version, smart-doc supports generating json files of Postman, You can use smart-doc to generate Postman json files for the entire project or all interfaces of a microservice. Then do the test by importing this json file into Collections of Postman. Export json.
The effect of importing json to Postman is as follows: 
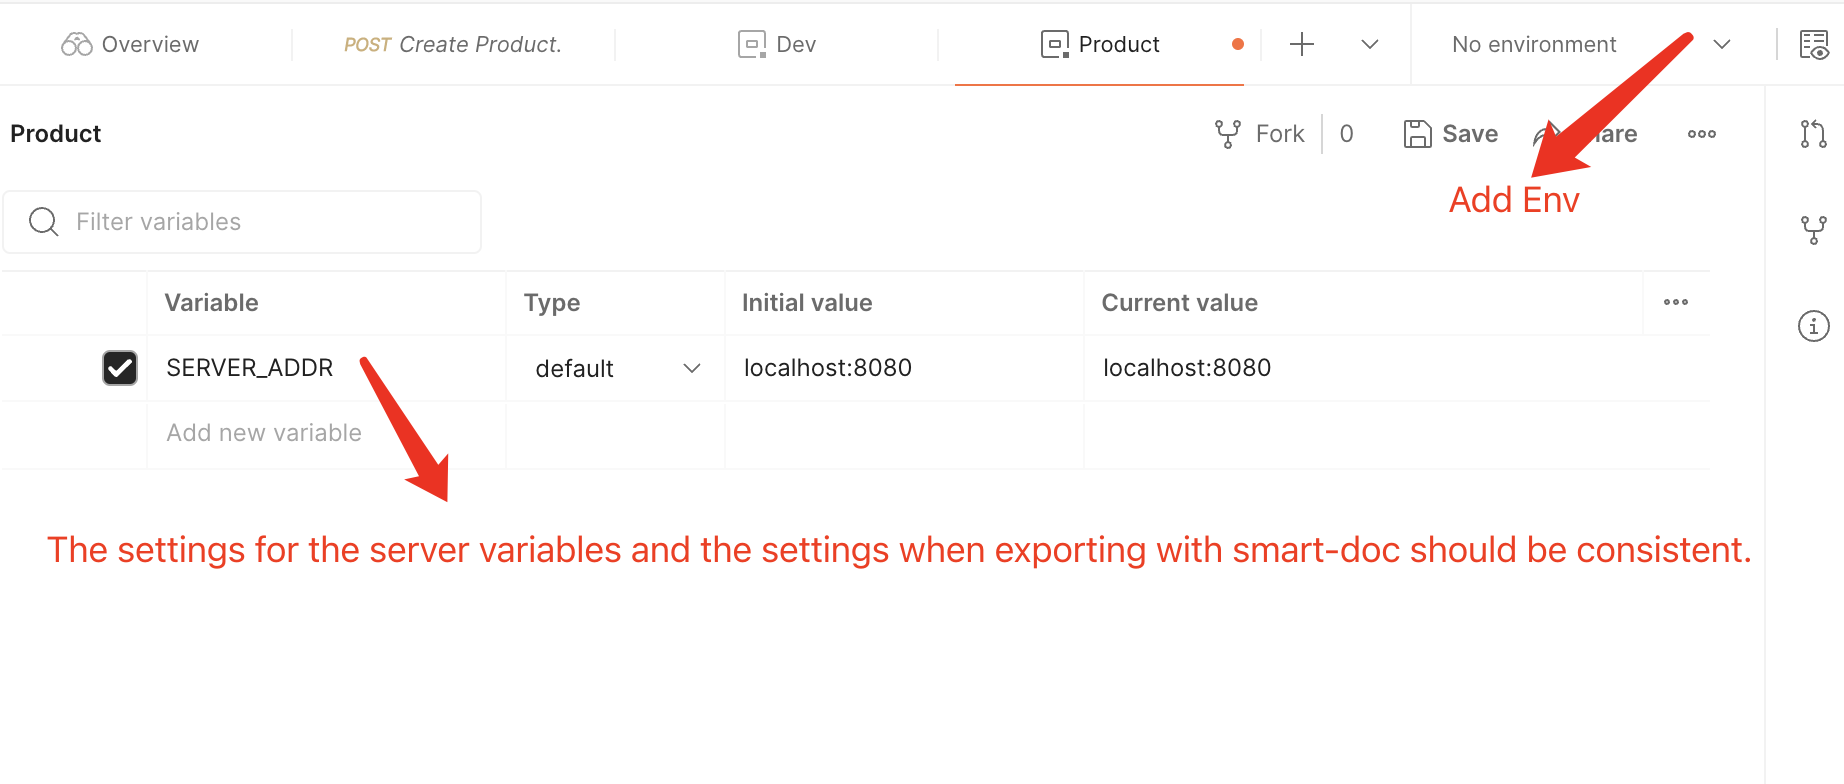
Set environment variables in postman
 Note: Don’t forget to set a name for the environment in
 Add Environment (for example: local development and testing), otherwise the save will not be successful according to the picture above.
The Json file automatically generated by smart-doc will be thoughtfully filled in with comments in Postman. If you write the mock value yourself, it will also be carried in. It’s much more worry-free than filling it out manually.
Swagger UI integration
smart-doc supports generating interface documents for the openapi 3.0+ specification, so you can use a document management system or ui interface that supports the openapi 3.0+ specification. Display the documentation generated by smart-doc. This article talks about how to quickly integrate swagger ui to test your interface during development.
Add dependencies
<!--swagger ui -->
<dependency>
     <groupId>org.springdoc</groupId>
     <artifactId>springdoc-openapi-ui</artifactId>
     <version>1.5.0</version>
</dependency>
The openapi specification version supported by smart-doc is relatively high, so it needs to be integrated with 1.5.0 or a higher version.
Configure Swagger UI
Add the following configuration in the application configuration file
# custom path for swagger-ui
springdoc:
   swagger-ui:
     path: /swagger-ui-custom.html
     operations-sorter: method
    #custom path for api docs
url: /doc/openapi.jsonurlis the key to the configuration, which refers to theopenapi.jsonfile generated bysmart-doc. And you need to generateOpenAPIundersrc/main/resources/static/doc.
After generating the API file, start your application and visit localhost:8080/swagger-ui-custom.html to see the document. Next, you can use this UI interface to test yourself during development.
Reminder: Just research other configurations of Swagger UI on your own, we don’t know how to do it either.